 The overlay of different information was one of the very first concepts of GIS. Like the core function, the corner stone, the first brick <...> that engaged the development of GIS on which all GIS users stand now. And it remains one of the most popularly used method for data analysis.
This concept is explained in every basic GIS cookbook, more objectively I haven't encountered any book that would not talk about overlay presenting it as a concept, technique, procedure, method. It's always presented in a very simple way by visualizing or explaining boolean operations. What else could be said? Apart from scale, resolution, data uncertainty problematics probably not much more, until we look into the GIS for Humanities (as Standford coins) and GIS concepts start to sway..
GIS concept suitability for social or humanitarian research is well presented in a book "The Spatial Humanities" writen by geographers, historians at the same time having the informatics education. The introduction starts with pointing that "the power of GIS for the humanities lies in its ability to integrate information from a a common location, regardless of format, and to visualize the results in combinations of transparent layers on a map of the geography share by data" and sadly adding that the existing GIS software was created for environmental planning questions and now it "requires humanists fit their questions, data, and methods to the rigid parameters of the software" which makes it challenging in the extreme fussing GIS with humanities.
I have personally experienced that while working on cultural areas visualization. And nothing else was as hard as to find a way to visualize just because the concepts themselves were not suitable for my task!
Firstly the cultural area was defined so differently by scientists from different science branches. And despite the interest in location where the area lays it was not less important to know WHO established the boundary, boundary that cannot be "diged out" or observed from the air as environmentalists could do. Boundary is drawn after long qualitative analysis, and what one can notice different by every scientist. Therefore for the humanities the author is as one of the key element as the other two: space-time and the property is.
(Space-time and Property elements are know as a geo-atom concept <x,Z,z(x)> <point in space-time, property, value> as the smallest GIS element, that is stored in databases. (M. Goodchild paper))
When trying to visualize the cultural area and having many possible boundaries of it one definitely has to stack the boundaries according to the researchers expertise, like archeological, historical, ethnological and so on.
Even after this trying to show the 'truest' f.e. ethnological area can seem impossible having several non fully overlapping boundaries. This problem I tried to solve with fuzzy concept and fuzzy set theory. I found an interesting article solving nicely a fuzzy region visualization while approximating it to plateau regions.that consists of finite number of crisp regions being disjoint or adjacent so that the different membership value can be given or degree of belonging assigned (Kanjilal, V et al. article). All is going to be much clear looking at example of one cultural area drawn by three different scientists (below, from my master thesis)
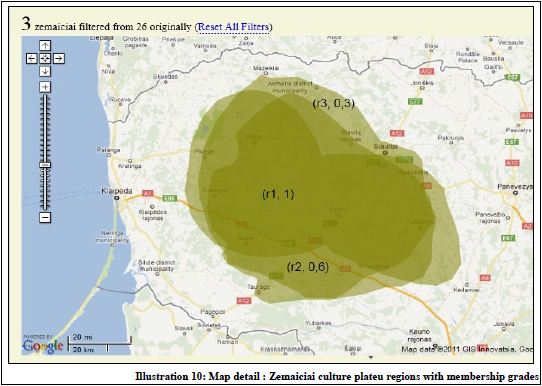
And so, to get the plateau regions the overlay concept is applied and visually it lets as distinguish the 'belonging' parts to the area of that culture as a unity.
BUT, still problems are encountered, when more areas around are visualized and on paper colors of cultures would start mixing, but in web applications the overlays always have the arrangement which goes under which and so the upper layers just hide the down ones.
What is more, the intersection (as a side function of overlay) of lets us to produce a new and the only one layer where all the items overlay, which would let us to produce the area with membership value 1, or the union (another function) would let us see all the are with every kind of membership, but it would be hard to use more then 2 datasets for such tasks and produce all possible areas with different memberships in one and only layer creating a plateau region layer, which I believe would be very useful tool for GIS for Humanities.
No comments:
Post a Comment